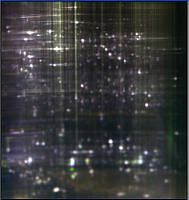
番茄叶和根二维差异凝胶电泳(DIGE)
丁香园
3267
1. 前言
蛋白质组学的一个主要研究技术是高分辨率的二维凝胶电泳技术(2-DE ) 。这项技术通常运用一维的电荷分离蛋白(等电聚焦)和二维的分子质量分离蛋白 (SDS-PAGE) 。一个二维凝胶系统的上样量可以达到毫克级并且可以分离数千个蛋白质点。虽然这项技术运用非常广泛,但是还是有一些技术上的限制。由于实验条件及主要蛋白溶解度的微小变化,在一个 2D 凝胶上的蛋白质表达模式不能准确地重复。这使得要精确研究蛋白质表达差异时的微小变化非常困难,并且要精确定量蛋白质含量的微小变化将更加困难。运用不同的程序软件比较分析在相同凝胶上的不同样本尽管可行,但要精确比较蛋白质点,需要对大量的图片进行处理和分析。可用的、有限的高动态蛋白标记技术及上述方面限制了二维蛋白质凝胶电泳中蛋白质点的分析速度和准确定量。
2D-DIGE 技术 [7] 是在 2D 凝胶技术的基础上增加了一个准确定量的元件。它可以在比较多个样本的蛋白质丰度变化的同时,对置信度进行统计学分析 [ 8,9] 。比较蛋白样品时是先用蓝色荧光染料标记,然后再混合,最后在相同的 2D 凝胶中进行分离。这样消除了蛋白在不同凝胶上的漂移,因此定量更准确。用 Cy 染料可以检测超过 4 个数量级的蛋白质丰度变化 [8] 。在合适的染料激发波下,通过持续获得的荧光成像,可以得到较为清晰的 2D 凝胶图像。为了尽量使一个蛋白质只标记一个分子的染料,蛋白质与染料的比率可以高达 20:1。在电泳时为了减少染料基团引起的蛋白质漂移,荧光染料的电荷与质量要很好地协调。通过在两个波长下对 DIGE 胶扫描后获得的图像进行大量的比较,可以定量分析同一个位点的同一个蛋白质或多个蛋白质。第三种染料的使用使得内标是可行的,它可以通过比较不同样本的一系列相应的凝胶图片来标准化数量。
然而 DIGE 技术还有本身的局限性。实际情况是,凝胶上只有一小部分的蛋白质被标记,也就是当奕光位点从胶上切下进行下一步分析时,大多数的蛋白质还留在胶里,特别是一些小分子蛋白质,甚至单个染料分子就可以在蛋白质迁移中引起变化。为了避免这种现象,可以在突光成像分析后再用 Sypro ruby 或银染胶(正如我们在这篇报道中所描述的 )。反过来,为了确保挖点正确,特别是在点多的区域时,比较这种荧光染料以及后染的图片也会产生一些问题。不过这仍是一种比较好的选择。另外一种可供选择的方法是用不同的试剂来标记蛋白质至饱和来避免这种问题,这种方法有所报道 [11] ,但没有被广泛使用。
来自于 DIGE 的量化分析的意义是另外一个争论热点。这种体系现在只有 Amer-sham Biosciences ( GE Health care 的一部分)拥有,但非常昂贵。合成并使用商业化的蓝色染料 N-羟基丁二酰亚胺活化酯可避免这个问题 [12] 。deCyder 软件可以识别蛋白质表达变化,统计学上非常有意义。用软件模式比较荧光强度相对于传统的手工调节图像的亮度及对比度而言将更客观、准确。为了避免曲解实验结果,两个样品的蛋白上样量要尽可能接近。由微小蛋白质的溶解性不同而不是电泳参数的原因造成的漂移,使用者至少要重复实验结果。有人试图通过 DNA 表达情况结合蛋白质组学数据及另一种标准运算法则 [14] 来克服这些问题。对不同胶上的样品进行更加准确的量化可以通过在一个更加复杂的方案中使用 3 种蓝色染料包括内标的使用来实现 [ 15 ] 。
2D-DIGE 在不同的生物学领域得到大量的运用,如食道 [10]、胃、结肠「 17 」、乳腺癌[18] 、白血病细胞[19] 、鼠肝脏毒性[ 20,21] 、脑组织[ 22,23] 及逆境胁迫下大肠杆菌 [24] 及酵母 [12] 的蛋白质变化分析。然而据我们了解,2D- DIGE 在植物蛋白质制备方面还没有公开的研究报告,这很可能是因为在植物组织蛋白质提取物的制备中,混合了大量的其他有机物质,这使得这种 2D 胶有些问题。这些物质包括复杂的碳水化合物、DNA、有机酸、多酚和其他的成熟植物的结构成分。我们实验室采用 2D-DIGE 技术进行了番茄响应热激、光照及盐胁迫下的蛋白质表达情况研究。首先,我们采用三氯乙酸(TCA ) /丙酮沉淀的方法制备了叶或根组织的蛋白质提取物,这种方法在以前的许多研究中运用过 [ 25,28] 。清洗 TCA/丙酮粉末水洗多余的酸,然后用含硫脲的缓冲液萃取 2D 胶样品缓冲液萃取。接着再测定每个样本的蛋白质含量,调节浓度使得每个样本的蛋白质含量一致,蓝色素标记蛋白质提取物后混合,再进行一维等电聚焦电泳。
用此种方法我们已经准确定量分析了番茄响应非生物胁迫的蛋白质的变化。我们还通过纳升液相色谱技术(nanoLC) 结合质谱技术(nanoLC-MS/MS) 以及数据库搜索定性分析了这些蛋白质。接下来我们详细地描述了番茄叶、根组织的蛋白质提取、CyDye 标记、2-DE、荧光成像及再染色的方法。我们还展示了番茄根在盐胁迫下差异蛋白表达情况的实验结果。
2. 材料
2.1 仪器
( 1 ) Bio-Rad PROTEAN IEF 细胞等电聚焦电泳仪。
( 2 ) Bio-Rad 24 cm 等电聚焦托盘及盖
( 3 ) Amersham Biosciences Ettan DALT six Electrophoresis Unit
( 4 ) Amersham Biosciences Ettan DALT
( 5 ) Amersham Biosciences Electrophoresis
( 6 ) Amersham Biosciences Typhoon 多波长突光扫描仪。
( 7 ) ThermolyneMaxiMix II 型旋涡器。
( 8 ) Eppendorf 5415D 型离心机。
( 9 ) Beckman Coulter Avanti J-20 型离心机。
( 10 ) Sigma Aldrich Micro SD 型离心机。
( 11 ) Fisher Scientific 恒温培养箱。
( 12 ) 陶瓷研体、捣锤。
( 13 ) 用来制备 24 cm X 20 cm 聚丙烯酰胺凝胶的低荧光玻璃(The Gel Company,旧金山,美国加利福尼亚州)
2.2 耗材
Amersham Biosciences 24 cm pH 3.0~10.0 NL 的干胶条。
2.3 化学试剂、缓冲液及溶液
( 1 ) Milli-Q 超纯水(电阻率 18 mΩ) 。
( 2 ) 叶片悬浮缓冲液:10% TCA ( EMD Chemical, Gibbstown, NJ) ,丙酮溶液含 0.07% ( V/V ) 巯基乙醇(EMD Chemical) 。
( 3 ) EDTA 水溶液:丙酮溶液含 0.07% ( V/V ) 巯基乙醇,2 mmol/L EDTA。
( 4 ) 100 mmol/L Tris-HCl pH 8.5 ( Sigma,St. Louis,MO)。
( 5 ) 硫脲缓冲液:2 mol/L 硫脲,7 mol/L 尿素,2% 二硫苏糖醇(DTT ) ( m/V ),4% 3- [ 3 - ( 胆酰胺丙基)二甲氨基 ] 丙磺酸内盐(CHAPS) (m/V )。
( 6 ) N,N - 二甲基甲酰胺(DMF) 。
( 7 ) CyDyeDIGE 荧光染料 Cy2、C3、Cy5。
( 8 ) 10 mmol/L 赖氨酸。
( 9 ) 固定 pH 梯度的缓冲液:0.012%,Amersham Bioscience De Streak 试剂、2 mol/L 硫脲,7 mol/L 尿素,2% ( W/V ) DTT,4% ( W/V ) CHAPS,2% IPG 缓冲液,pH 3~10 NL,少量溴酚蓝。
( 10 ) 矿物油。
( 11 ) 乙醇。
( 12 ) 冰醋酸
( 13 ) 亲和硅烷和剥离硅烷。
( 14 ) 亲和硅烷工作液:8 ml 乙醇,200 μl 冰醋酸,1.8 ml Mlli-Q 超纯水,10 μl 亲和硅烷。
( 15 ) 40% 丙烯酰胺储液(40% 丙烯酰胺/甲叉双丙烯酰胺 37.5 : 1,2.6% C ) 。
( 16 ) 1.5 mol/L Tris-HCl,pH 8.8。
( 17 ) 10% SDS 溶液(m/V ) 。
( 18 ) 10% 硫酸铵溶液(m/V ) 。
( 19 ) N,N,N,N-四甲基二乙胺(TEMED ) 。
( 20 ) 还原再平衡缓冲液:50 mmol/L Tris-HCl,6 mol/L 尿素,30% 甘油(87% ) ,2% SDS,0.5% DTT。
( 21 ) 烃化重平衡缓冲液:50 mmol/L Tris-HCl,6 mol/L 尿素,30% 甘油(87% ) ,2% SDS,4.5% 碘乙酰胺。
( 22 ) SDS 电泳缓冲液:25 mmol/L Tris-HCl,192 mmol/L 氨基乙酸,0.2% SDS。
( 23 ) 0.5% ( m/V ) 琼脂糖封闭液:0.5% ( m/V ) 琼脂糖(Bio-Rad),25 mmol/L Tris-HCl,192 mmol/L 氨基乙酸(Bio- Rad) ,0.2% (m/V ) SDS,溴酚蓝,用之前用微波加热使琼脂糖液化。
4. 注释
( 1 ) EDTA 洗液包括巯基乙醇和 EDTA,在蛋白提取过程中尽量减少蛋白质的水解,巯基乙醇可以防止二硫键的形成。
( 2 ) 为了确保蛋白质提取物的 pH 不会由于残留的 TCA 而降低,这个清洗步骤是非常重要的。一个可靠的指示是否有残留酸存在的方法为:用标准的 SDS-PAGE 样品缓冲液来抽提另外一份 TCA/丙酮植物组织材料,如果溴酚蓝为亮黄色则表示 pH 为酸性。
( 3 ) CyDye 荧光试剂是 Amersham Biosciences 的商业产品。有 Cy2、Cy3 和 Cy5,它们都是蓝色素的衍生物,它们在电荷及分子质量方面非常相似,但并不一样,它们具有不一'样的突光特性。
( 4 ) 这里描述的方法是最少蛋白质标记方法 [8] ,因此用 1 : 20 的染料/蛋白质的比例标记蛋白质。绝大多数的蛋白质没有被标记。运用这种方法产生的一个问 题是使用的 CyDye 染料大小的轻微差异会引起标记的及未标记的蛋白质的迁移,特别是一些小分子质量的蛋白质。这个问题可以通过运用后染技术解决,后染技术将未标记的残留蛋白质进行染色,然后基于后染的位置将蛋白质点挖出进行下一步的分析。
( 5 ) 每个样品的蛋白质浓度在每一次分开抽提中需尽可能用标准的蛋白质定量实 验技术进行精确定量,并且体积也要调整到每一种荧光染料标记的蛋白质量是一样的。如果提取的蛋白质浓度太低,可以多次提取,用 TCA/丙酮沉淀,标记前再合并到一起。
( 6 ) 对于一个简单的两两比较实验,两个样品用 Cy3 和 Cy5 标记,它们的相对荧光强度可以直接比较。对于比较相对表达差异超过复本或超过一套样本的不同组分时,在相对定量统计学中有必要引入一个 Cy2 标记的内标。
( 7 ) 如果实验的目的是为了运用质谱技术来鉴定差异表达的蛋白质,有必要用同体积的没有标记的蛋白质示踪荧光标记的蛋白质。对于凝胶上有 500 μg 的总蛋白质,必须保证在最后的混合液中 IPG 缓冲液浓度为 0.5%~1.0%。
( 8 ) 对于两两比较实验,图像分析用 DeCyder DIA 模型分析。如果实验要重复 3 次并且用了 Cy2 标记的内标(见注释 3) ,图像分析可以 DeCyder BVA 模型,这种分析允许统计学评估,如 t-检测用来测定蛋白质表达变化的意义。
( 9 ) 突光染料如 Sypro Ruby [31] 或 Deep Purple [ 32 ] 可以用来后染,但是需要使用荧光兼容的蛋白点机械挖点系统。
参考文献
1. O'Farrell, P. H. (1975) High resolution two-dimensional electrophoresis of proteins. / . Biol. Chem. 250, 400 7-402 1.
2 . Gorg, A., Obermaier, C., Boguth, G., et al. (2000) The current state of two-dimensional electrophoresis with immobilized pH gradients. Electrophoresis 2 1,1037-1053.
3. Haynes, P. A., Fripp, N., and Aebersold, R. (1998) Identification of gel separatedproteins by liquid chromatography-electrospray tandem mass spectrometry: comparison of methods and their limitations. Electrophoresis 1 9 , 939-945.
4. Haynes, P., Miller, I., Aebersold, R., et al. (1998) Proteins of rat serum I:establishing a reference 2-DE map by immunodetection and microbore highperformance liquid chromatography- electrospray mass spectrometry. Electrophoresis 1 9 , 1484-1492.
5. Cooper, B., Eckert, D., Andon, N. L., Yates, J. R., an / d Haynes, P. A. (2003)Investigative proteomics: identification of an unknown plant virus from infectedplants using mass spectrometry. J. A m . S o c . M a s s S p e c tr o m . 1 4 , 736-741.
6. Andon, N. L., Hollingworth, S., Koller, A., Greenland, A. J., Yates, J. R. Ill, andHaynes, P. A. (2002) Proteomic characterization of wheat amyloplasts using identification of proteins by tandem mass spectrometry. P r o te o m ic s 2 , 1156-1168.
7. Unlu, M., Morgan, M. E., and Minden, J. S. (1997) Difference gel electrophoresis: a single gel method for detecting changes in protein extracts. E le c tr o p h o r e s is1 8 , 2071-2077.
8 . Tonge, R., Shaw, J., Middleton, B., et al. (2001) Validation and development offluorescence two-dimensional differential gel electrophoresis proteomics technology. P r o te o m ic s 1, 377-396.
9. Von Eggeling, F., Gawriljuk, A., Fiedler, W., et al. (2001) Fluorescent dual colour2D-protein gel electrophoresis for rapid detection of differences in protein patternwith standard image analysis software. I n t. J. M o l. M ed . 8, 3 1 3 - 3 1 1 .
10. Zhou, G., Li, H., DeCamp, D., et al. (2002) 2D differential in-gel electrophoresisfor the identification of esophageal scans cell cancer- specific protein markers. M o l.C ell. P r o te o m ic s 1, 117—124 .
11. Shaw, J., Rowlinson, R., Nickson, J., et al. (2003) Evaluation of saturation labelling two-dimensional difference gel electrophoresis fluorescent dyes. P r o te o m ic s3, 1181-1195.
12 . Hu, Y., Wang, G., Chen, G. Y., Fu, X., and Yao, S. Q. (2003) Proteome analysis ofS a c c h a r o m y c e s c e r e v is ia e under metal stress by two-dimensional differential gelelectrophoresis. E le c tr o p h o r e s is 24, 1458-1470.
13. Kreil, D. P., Karp, N. A., and Lilley, K. S. (2004) DNA microarray normalizationmethods can remove bias from differential protein expression analysis of 2D difference gel electrophoresis results. B io in fo r m a tic s 20 , 2026 -2034.
14 . Karp, N. A., Kreil, D. P., and Lilley, K. S. (2004) Determining a significant changein protein expression with DeCyder during a pair-wise comparison using two-dimensional difference gel electrophoresis. P r o te o m ic s 4 , 1421-1432.
15. Alban, A., David, S. 0 ., Bjorkesten, L., et al. (2003) A novel experimental designfor comparative two-dimensional gel analysis: two- dimensional difference gel electrophoresis incorporating a pooled internal standard. P r o te o m ic s 3, 36-44.
16. Lee, J. R., Baxter, T. M., Yamaguchi, H., Wang, T. C., Goldenring, J. R., andAnderson, M. G. (2003) Differential protein analysis of spasomolytic polypeptideexpressing metaplasia using laser capture microdissection and two-dimensionaldifference gel electrophoresis. A p p l. I m m u n o h is to c h e m . M o l. M o r p h o l. 11,188-193.
17. Friedman, D. B., Hill, S., Keller, J. W., et al. (2004) Proteome analysis of humancolon cancer by two-dimensional difference gel electrophoresis and mass spectrometry. P r o te o m ic s 4 , 793-811.
18 . Somiari, R. I., Sullivan, A., Russell, S., et al. (2003) High- throughput proteomicanalysis of human infiltrating ductal carcinoma of the breast. P r o te o m ic s 3,1863-1873.
19 . Wang, D., Jensen, R., Gendeh, G., Williams, K., and Pallavicini, M. G. (2004)Proteome and transcriptome analysis of retinoic acid-induced differentiation ofhuman acute promyelocytic leukemia cells, NB4. J. P r o te o m e R es.3, 627-635.
20. Ruepp, S. U., Tonge, R. P., Shaw, J., Wallis, N., and Pognan, F. (2002) Genomicsand proteomics analysis of acetaminophen toxicity in mouse liver. T o xico l. Sci.65, 135-150.
21. Kleno, T. G., Leonardsen, L. R., Kjeldal, H. 0 ., Laursen, S. M., Jensen, O. N., andBaunsgaard, D. (2004) Mechanisms of hydrazine toxicity in rat liver investigatedby proteomics and multivariate data analysis. P r o te o m ic s 4, 868-880.
22. Swatton, J. E., Prabakaran, S., Karp, N. A., Lilley, K. S., and Bahn, S. (2004)Protein profiling of human postmortem brain using 2-dimensional fluorescencedifference gel electrophoresis (2-D DIGE). M o l. P s y c h ia tr y 9, 128-143.
23. Van den Bergh, G., Clerens, S., Vandesande, F., and Arckens, L. (2003) Reversed-phase high-performance liquid chromatography prefractionation prior to two-dimensional difference gel electrophoresis and mass spectrometry identifies newdifferentially expressed proteins between striate cortex of kitten and adult cat. E le ctr o p h o r e s is 2A,1471-1481.
24. Yan, J. X., Devenish, A. T., Wait, R., Stone, T., Lewis, S., and Fowler, S. (2002)Fluorescence two-dimensional difference gel electrophoresis and mass spectrometry based proteomic analysis of E s c h e r ic h ia co li. P r o te o m ic s 2, 1682-1698.
25. Damerval, C., de Vienne, D., Zivy, M., and Thiellement, H. (1986) Technicalimprovements in two-dimensional electrophoresis increase the level of geneticvariation detected in wheat-seedling proteins. E le c tr o p h o r e s is 7, 52-54.
26. Roller, A., Washburn, M. P., Lange, B. M., et al. (2002) Proteomic survey of metabolic pathways in rice. P ro c. N a tl. A c a d . S ci. U. S. A .99, 11969-11974.
27. Thiellement, H., Zivy, M., Colas des Francs, C., Bahrman, N., and Granier, F.(1987) Two-dimensional gel electrophoresis of proteins as a tool in wheat genetics. B io c h im ie 69, 781-787.
28. Tsugita, A., Kawakami, T., Uchiyama, Y., Kamo, M., Miyatake, N., and Nozu, Y.(1994) Separation and characterization of rice proteins. E le c tr o p h o r e s is 15,708-720.
29. Wilm, M., Shevchenko, A., Houthaeve, T., et al. (1996) Femtomole sequencingof proteins from polyacrylamide gels by nano-electrospray mass spectrometry.N a tu r e 379, 466-469.
30. Andon, N. L., Eckert, D., Yates, J. R. Ill, and Haynes, P. A. (2003) High-throughput functional affinity purification of mannose binding proteins from O ryz a sa tiva .P r o te o m ic s 3 , 1270—1278.
31. Berggren, K., Chernokalskaya, E., Steinberg, T. H., et al. (2000) Background-free,high sensitivity staining of proteins in one- and two- dimensional sodium dodecylsulfate-polyacrylamide gels using a luminescent ruthenium complex. E le c tr o p h o r es is 21, 2509-2521.
32. Mackintosh, J. A., Choi, H. Y., Bae, S. H., et al. (2003) A fluorescent natural product for ultra sensitive detection of proteins in one-dimensional and two-dimensional gel electrophoresis. P r o te o m ic s 3, 2273-2288.


