V294.PART II,Chapter 3 划痕实验(Wound-Healing Assay)
丁香园
22632
PART II:BASIC CELL MIGRATION AND RELATED ASSAYS
vol.294 Guan J.-L. (ed.) Cell Migration-Developmental Methods and Protocols Chapter 3
Wound-Healing Assay
Luis G. Rodriguez, Xiaoyang Wu, and Jun-Lin GuanSummary
The wound-healing assay is simple, inexpensive, and one of the earliest developedmethods to study directional cell migration in vitro. This method mimics cell migrationduring wound healing in vivo. The basic steps involve creating a “wound” in a cell monolayer,capturing the images at the beginning and at regular intervals during cell migrationto close the wound, and comparing the images to quantify the migration rate of thecells. It is particularly suitable for studies on the effects of cell–matrix and cell–cellinteractions on cell migration. A variation of this method that tracks the migration ofindividual cells in the leading edge of the wound is also described in this chapter.
Key Words: Cell migration; wound healing; extracellular matrix; transfection; image capture and analysis; time-lapse microscopy.
1. Introduction
The wound-healing assay is one of the earliest developed methods to studycell migration in vitro (1). This method is based on observation of cell migrationinto a “wound” that is created on a cell monolayer. Although not an exactduplication of cell migration in vivo, this method mimics to some extent migrationof cells in wound healing. For example, denuding part of the endotheliumin the blood vessels will induce endothelial cell migration into the denuded areato close the wound (2). Depending on the cell type, cells migrate into the woundas loosely connected populations (e.g., fibroblasts) or as sheets of cells (e.g.,epithelial and endothelial cells), which also mimic the behavior of these cellsduring migration in vivo.
In comparison with other popular in vitro methods, such as time-lapse microscopyand Boyden chamber assays, the wound-healing assay is particularly suitablefor studies of directional cell migration and its regulation by cell interaction with extracellular matrix (ECM) and cell–cell interactions. Migration of the cellsis regulated by both the ECM under the cells and soluble factors (3,4) as well asintercellular interactions in the case of epithelial and endothelial cells (5). Theeffects of each of these factors on directional cell migration can be studied usingthe wound healing method. More recently, this assay also has been combinedwith microinjection or transfection to assess the effects of expression of exogenousgenes on migration of individual cells (6–8). This is probably the simplestmethod to study cell migration in vitro and the only that requires commonand inexpensive supplies found in most labs that are capable of cell culturing.
The basic steps involve creation of a “wound” on monolayer cells, capture ofimages at the beginning and regular intervals during cell migration to close thewound, and comparison of the images to determine the rate of cell migration.
More recently, a wound-healing assay has been used to track migration ofindividual cells at the leading edge of the wound to determine the role of particulargenes in the regulation of directional migration (8). This requires the aidof time-lapse microscopy and image analysis software and differs from the conventionaluse of time-lapse microscopy in that it measures directional migrationof the cells in the population of migrating cells into the wound instead of randommigration of sparsely plated cells. This variation will be described subsequently(see Subheading 3.).
2. Materials
1. 60-mm or other size tissue culture dishes.
2. Razor or extra fine Sharpie? marker.
3. 1 mg/mL fibronectin stock.
4. 1 mg/mL poly-L-lysine (PLL) stock.
5. Phosphate-buffered saline (PBS).
6. 2 mg/mL Bovine serum albumin (BSA).
7. Versene with trypsin.
8. Dulbecco’s modified Eagle’s medium cell culture media with supplements (serum,antibiotics).
9. p200 Pipet tips.
10. Phase contrast microscope.
11. Camera.
Optional and for tracking individual cells:
12. Video camera.
13. Image analysis software.
14. Stage incubator.
15. Fluorescence microscope.
16. LipofectAmine and PLUS transfection reagents (Life Technologies).
17. Plasmid-encoding green fluorescent protein (GFP) or other markers.
18. CO2 independent media.
3. Methods
3.1. Measurement of Migration as Population of Cells1. Prepare 60-mm dishes with markings on the outer bottom of the dish to be usedas reference points during image acquisition. Acquisition of images requires thematching of the first image with the second image acquired in steps 7 and 9.
Marking the tissue culture dish can be achieved by numerous methods to obtainthe same field during the image acquisition. Etching lines lightly with a razorblade on the bottom of the dish provides a good reference under the microscopeand can be visualized with the naked eye for creating the wound itself. Keep inmind when using a razor not to separate the lines too much because the goal is toobserve two lines in the same field under magnification. Matching the images isessential for quantitative analysis (see Note 1).
2. Coat the dishes with 3 mL of either 10 μg/mL fibronectin or 50 μg/mL poly-Llysineas a control by incubating the dishes overnight at 4°C or several hours at37°C without rotation or shaking. These are for studies of fibroblast migration.
For other cell types, other appropriate ECM substrates can be used.
3. When ready to proceed, aspirate off unbound ECM substrate and block the coateddishes with 3 mL of 2 mg/mL bovine serum albumin for 1 h at 37°C.
4. Resuspend subconfluent cells growing in a tissue culture dish by washing cellsonce with PBS, add trypsin containing versene, resuspend cells with completemedia, and obtain cell counts for all cells to be plated. Cells should be dispersedgently by pipetting and/or rocking the dish before incubation so that cells aredistributed equally among the plate.
5. Wash the prepared dishes once with PBS and fill the dish with 3–5 mL of media(see Note 2). Plate 1 × 10⁶ NIH 3T3 cells to create a confluent monolayer ontothe prepared 60 mm dish. Allow cells to adhere and spread completely for approx4 h under proper incubation. If different cell types or different size dishes areused, adjust the number of cells used to create a confluent monolayer.
6. Create a wound by manually scraping the cell monolayer with a p200 pipet tip.
Wash the cells once with 1 mL of desired media and replace with 5 mL of thesame media. The wound should be created relative to the marking/reference pointon the dish. For example, the razor blade method, being the least expensive andmost popular, creates a point of reference. The wound is created perpendicular tothe marking on the dish.
7. Acquire the first image by using the markings on the culture dish as a referencepoint. Place the reference mark outside the capture image field but within theeyepiece field of view such that the reference mark can be aligned later for thesubsequent image acquisition.
8. Incubate dishes in a tissue culture incubator for 8–18 h (see Note 3).
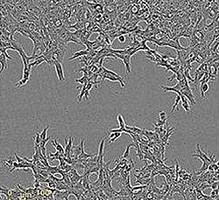
9. Match the photographed region acquired in step 7 and acquire a second image(Fig. 1).
10. The images acquired above can be analyzed quantitatively by several methods.
The migration of cells can be determined by the number of cells that cross intothe wound area from their reference point at time zero. This method provides large sample sizes that are easily quantified statistically. Alternatively, variousmethods can be used to measure the distance or area of the wounded region lackingcells. Free software is available that simplifies this process with convenienttools (Website: http://rsb.info.nih.gov/ij/). Additionally, more elaborate commercialsoftware is available that can automate the measurement process (MediaCybernetics; Carlsbad, CA).
Fig. 1. Example of images acquired at 0 and 18 h in wound-healing assay. Cellsshown are uninduced (U) and induced (I), NIH 3T3 cells expressing wild-type 14-3-3β. The dotted lines define the areas lacking cells.
3.2. Tracking Migration of Individual Cells in the Wound-Healing Assay1. Prepare 60-mm culture dishes as described in step 1 (Subheading 3.1.) to beused to match wounds during image acquisitions. If time-lapse microscopy willbe used, this step is not necessary (see Note 4).
2. Plate growing NIH 3T3 cells at 50–60% confluency 12 to 18 h prior to transfection.
Transfect NIH 3T3 cells with plasmid encoding the gene of your interestalong with a marker plasmid (i.e., GFP) in a 7:1 ratio. Alternatively, a vectorencoding GFP fusion protein containing the gene of your interest can be used.
Cells are transfected with LipofectAmine and PLUS transfection reagents (LifeTechnologies) per the manufacturers instructions.
3. When cells reach 100% confluency (usually 24 to 48 h after transfection), createa wound with a p200 pipet tip, as described in step 6 (Subheading 3.1.). Washthe plates once and replace with the desired medium. If time-lapse microscopywill be used, CO2 independent media will be required.
4. Observe the cells under a fluorescence microscope to ensure that enough cells inthe leading edge of the wound are positively transfected (i.e., as marked by GFP;see Note 5). Acquire both phase contrast and fluorescence images every 2 h bymatching the wounded region until the wound has completely closed (usuallyabout 10 h). Return cells to a 37°C cell culture incubator between images unlessCO2-independent media was used.
5. Calculate the rate of migration of the transfected cells by measuring the distancetraveled toward the center of the wound after 8 h using a motility program, likeOMAware or similar, described previously (8). It is useful to draw an imaginaryline in the middle of the wound in the images captured (Fig. 2).
Fig. 2. Measurement of individual cell migration in wound-healing assay. NIH 3T3cells grown on fibronectin (10 μg/mL) were with a plasmid-encoding GFP. One dayafter transfection, the cell monolayer was wounded with a pipet tip, incubated at 37°C,and fluorescent and phase contrast images were captured at regular intervals as indicated. The rate of migration was measured by quantifying the total distance that theGFP+ cells (as indicated by arrows) moved from the edge of the wound toward thecenter of the wound (marked by imaginary dotted lines). This figure is reprinted fromref. 8 with permission of the American Society for Cell Biology.
4. Notes
1. Alternative to using a razor, marked culture dishes and stickers that attach to thebottom of the dish are available commercially for use as reference markers.
2. The amount of serum in the media needs to be determined for the particular celltypes used. It is recommended to use less than the amount in the regular growthmedia to minimize cell proliferation during the period of assay. However, usingtoo little may lead to apoptosis and/or cell detachment for some cell types. ForNIH 3T3 cells, which are normally cultured in 10% calf serum, we find that 1–2%calf serum is optimal for the assay.
3. The amount of incubation time should be determined empirically for the particularcell types under study. However, incubations longer than overnight are notrecommended as differences in cell proliferation may start to contribute to thedifferences in the migration assay. The most desirable length of incubation timeis one where the cells in the fastest migrating condition just reach complete closureof the wound. The dishes can be taken out of the incubator and examinedperiodically and then put back to resume incubation.
4. An automated time-lapse microscope equipped with a temperature control chambercan be used under CO2-independent media, as the same region would beacquired automatically. However, this usually is not very practical for an 18-hincubation as time constraints on a microscope usually interfere.
5. The cells at the leading edge of the wounded monolayer are most migratory andusually are chosen as the ones that are examined for migration. The rate of theirmigration reflects the overall rate of wound closure of the migrating monolayer ofcells. In addition, these cells are usually not dividing (whereas cells in the backcould), thus not presenting the complication of single cells under tracking becomingdouble. Therefore, the effects of genes on migration are usually assessed using the cells at the leading edge, which would be the greatest. In the past, more complexmicroinjection methods have been used to introduce the genes (and proteins)along with a marker into the cells at the leading edge for this purpose. However,the high-transfection efficiency of the lipofectamine method coupled with a timelapsemicroscope now allows such studies in many cell types, such as the NIH3T3 cells, as outlined in this chapter. This simpler approach, which also avoids theuse of sophisticated and expensive equipment, should permit more laboratories touse the method.
Acknowledgments
This work was supported by the NIH grant GM48050 (J.G.) and a predoctoralfellowship GM64086 (L. G. R.).
References
1. Todaro, G. J., Lazar, G. K., and Green, H. (1965) The initiation of cell division ina contact-inhibited mammalian cell line. J. Cell Physiol. 66, 325–333.
2. Haudenschild, C. C. and Schwartz, S. M. (1979) Endothelial regeneration. II.Restitution of endothelial continuity. Lab Invest. 41, 407–418.
3. Han, D. C., Rodriguez, L. G., and Guan, J-L. (2001) Identification of a novelinteraction between integrin beta1 and 14,-3-3beta. Oncogene 20, 346–357.
4. Lipton, A., Klinger, I., Paul, D., and Holley, R. W. (1971) Migration of mouse3T3 fibroblasts in response to a serum factor. Proc. Natl. Acad. Sci. USA 68,2799–2801.
5. Underwood, P. A., Bean, P. A., and Gamble, J. R. (2002) Rate of endothelial expansionis controlled by cell:cell adhesion. Int. J. Biochem. Cell Biol. 34, 55–69.
6. Etienne-Manneville, S. and Hall, A. (2001) Integrin-mediated activation of Cdc42controls cell polarity in migrating astrocytes through PKCzeta. Cell 106, 489–498.
7. Fukata, Y., Oshiro, N., Kinoshita, N., Kawano, Y., Matsuoka, Y., Bennett, V., et al.(1999) Phosphorylation of adducin by Rho-kinase plays a crucial role in cell motility.J. Cell Biol. 145, 347–361.
8. Abbi, S., Ueda, H., Zheng, C., Cooper, L. A., Zhao, J., Christopher, R., et al. (2002) Regulation of focal adhesion kinase by a novel protein inhibitor FIP200.Mol. Biol. Cell 13, 3178–3191.