合作专家 | 王琼博士
药理学 中国科学院上海药物研究所

审核专家 | 聂壹峰博士
纳米生物医学 中国科学院大学
简介
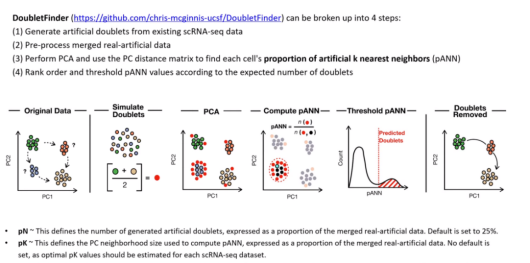
DoubletFinder 方法基于表达矩阵识别双细胞,将模拟的双胞与原细胞矩阵混合,进行降维聚类,根据每个细胞 k 近邻细胞中模拟双胞的比例结合 Poisson 分布进行排序、过滤。
单细胞测序期望每个单细胞反应室(GEM)里包含一个细胞或者细胞核,即每个 barcode 对应一个真实的细胞,但是单个 barcode 包含的细胞数目随着上机细胞的浓度而改变,实际数据中会有两个或多个细胞共用一个 barcode 的情况,我们称之为 doublets。Doublets 根据转录水平不同可分为两类:
Homotypic doublets: doublets derived from transcriptionally similar cells
Heterotypic doublets: doublets derived from transcriptionally distinct cells
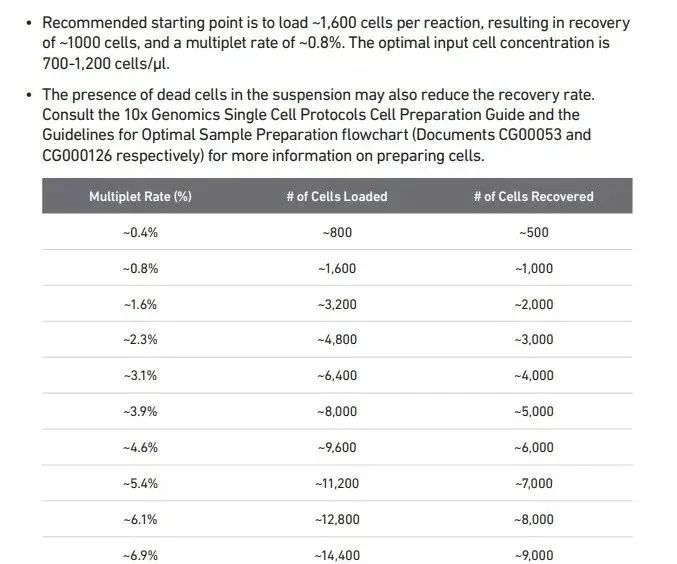
随着细胞数增多,双细胞比例会增加。下表是 10X 平台的双细胞率,根据 Poisson 分布确定,可以参照下表计算自己的数据中双细胞的比例。
原理
DoubletFinder 方法基于表达矩阵识别双细胞,将模拟的双胞与原细胞矩阵混合,进行降维聚类,根据每个细胞 k 近邻细胞中模拟双胞的比例结合 Poisson 分布进行排序、过滤。
材料与仪器
R studio 软件
DoubletFinder R 包
GEO:GSE136103
步骤
本次复现的文章是 2019 年发表在 Nature 的文章:Resolving the fibrotic niche of human liver cirrhosis at single-cell level。选用了文章中 healthy 组小鼠的单细胞测序结果进行 doubletFinder R 包使用的演示。
安装 DoubletFinder
remotes::install_github('chris-mcginnis-ucsf/DoubletFinder')
library(DoubletFinder)
#install.packages(「Seurat」)
#install.packages('hdf5r')
#install.packages("tidyverse")
library(Seurat)
##数据预处理(cellranger 数据)##########
###
data_dir<-"/home/shpc_100670/liver/mice CCL4/raw data/GSE136103-M liver healthy"
list.files(data_dir)
GSE136103_healthy<- Read10X(data.dir = data_dir)
dim(GSE136103_healthy)
创建 seurat 对象
#初步过滤,每个细胞中至少可检测到 200 个基因,每个基因至少在 3 个细胞表达 GSE136103_healthy <-
CreateSeuratObject(GSE136103_healthy, project = "healthy", min.cells=3, min.features=200)
GSE136103_healthy
#ncol(GSE136103_healthy1_cd45)、saveRDS(GSE136103_healthy,'GSE136103_M_healthy.rds')
##DoubletFinder############
#devtools::install_github('chris-mcginnis-ucsf/DoubletFinder')
library(DoubletFinder)
library(multtest)
if(!require(multtest))install.packages("multtest")
if(!require(Seurat))install.packages("Seurat")
if(!require(dplyr))install.packages("dplyr")
if(!require(mindr))install.packages("mindr")
if(!require(mindr))install.packages("tidyverse")
library(Seurat)
library(Rcpp)
library(harmony)
library(dplyr)
library(patchwork)
library(ggplot2)
##QC and filtering
GSE136103_healthy[["percent.mt"]] <- PercentageFeatureSet(GSE136103_healthy, pattern = "^mt-")
GSE136103_healthy<- subset(GSE136103_healthy, subset = nFeature_RNA > 300 & percent.mt < 30)
##pre-process standard workflow
GSE136103_healthy <- NormalizeData(GSE136103_healthy)
GSE136103_healthy <- FindVariableFeatures(GSE136103_healthy)
GSE136103_healthy <- ScaleData(GSE136103_healthy)
GSE136103_healthy <- RunPCA(GSE136103_healthy)
ElbowPlot(GSE136103_healthy)
GSE136103_healthy <- FindNeighbors(GSE136103_healthy, dims = 1:20)
GSE136103_healthy <- FindClusters(GSE136103_healthy)
GSE136103_healthy <- RunUMAP(GSE136103_healthy,dims = 1:20)
## pK Identification (no ground-truth)
sweep.res.list_nsclc <- paramSweep_v3(GSE136103_healthy, PCs = 1:20, sct=FALSE)
sweep.stats_nsclc <- summarizeSweep(sweep.res.list_nsclc, GT = FALSE)
bcmvn_nsclc <- find.pK(sweep.stats_nsclc)
ggplot(bcmvn_nsclc,aes(pK,BCmetric,group=1))+
geom_point()+
geom_line()
pK<-bcmvn_nsclc %>% #select the pk that corresponds to max bcmvn to optimize doublet det
filter(BCmetric==max(BCmetric))%>%
select(pK)
pK<-as.numeric(as.character (pK[[1]]))
## Homotypic Doublet Proportion Estimate
annotations<-GSE136103_healthy@meta.data$seurat_clusters
homotypic.prop <- modelHomotypic(annotations)
## ex: annotations <- seu_kidney@meta.data$ClusteringResults
nExp_poi <- round(0.02undefinednrow(GSE136103_healthy@meta.data))
nExp_poi.adj <- round(nExp_poundefined(1-homotypic.prop))
## Assuming 7.5% doublet formation rate - tailor for your dataset
##10000 7.6%
###9000 6.9%
###8000##7000 5.4%
##6000 4.6%
##5000 3.9%
###4000 3.1%
###3000 2.3%
## Run DoubletFinder with varying classification stringencie
GSE136103_healthy <- doubletFinder_v3(GSE136103_healthy, PCs = 1:20, pN = 0.25, pK = pK, nExp = nExp_poi.adj, reuse.pANN = FALSE,sct=FALSE)
## Plot results
View(GSE136103_healthy@meta.data)
names(GSE136103_healthy@meta.data)
DimPlot(GSE136103_healthy,reduction = 'umap',group.by = "DF.classifications_0.25_0.2_56")
###number of singlets and doublets
table(GSE136103_healthy@meta.data$DF.classifications_0.25_0.2_56)
代码运行结束。(注意代码的空格行数)
结果展示:

注意事项
1. 单细胞的 doublet 在后续分析中可能会影响细胞亚群的分型,质控时有必要去除,但预测的 doublet 不一定全都是双细胞,不同的 pipeline 分析的结果也存在差异,所以在去除 doublet 的时候需谨慎,需多个结果综合分析判断;
2. 使用 DoubletFinder 软件分析 doublets 需要注意的是,dedoublets 可能会过滤一些真正的单细胞;
3. 以上流程针对单个样本操作是没问题的,当涉及到多个单细胞样本的时候,往往需要先独立的对每个样本进行分析然后再合并。
4. DoubletFinder 需针对每一个 sample 进行单独分析,且应在 seurat 对数据进行处理前进行。
来源:丁香实验