Sleep and EEG Phenotyping in Mice
互联网
- Abstract
- Table of Contents
- Materials
- Figures
- Literature Cited
Abstract
Although alternative, noninvasive methods are being developed, current research on rodent sleep still almost exclusively relies on recording the electroencephalogram (EEG). EEG provides information about the electrical activity of the brain and is, in combination with the electromyogram (EMG), primarily used to distinguish the different sleep and wake states. This unit describes the technique used to record EEG and EMG signals in freely moving mice, under standard laboratory conditions or specific experimental protocols such as sleep deprivation (SD). In addition to its use to determine behavioral state, the EEG contains a wealth of information concerning rhythmic brain activity that can be extracted using signal analysis tools. We will describe the protocol for implantation of EEG and EMG electrodes, provide examples of experimental designs, and discuss data acquisition and analysis illustrating the type of information that can be obtained from the EEG in mice. Curr. Protoc. Mouse Biol. 2:54?74 © 2012 by John Wiley & Sons, Inc.
Keywords: EEG; sleep; mice; signal analysis; spectral analysis
Table of Contents
- Introduction
- Basic Protocol 1: Implantation of EEG and EMG Electrodes
- Basic Protocol 2: Recording EEG/EMG During Experiment
- Basic Protocol 3: Data Acquisition
- Basic Protocol 4: Determining Behavioral State Based on the EEG and EMG Signals (i.e., “Scoring”)
- Basic Protocol 5: Spectral Analysis
- Commentary
- Literature Cited
- Figures
Materials
Basic Protocol 1: Implantation of EEG and EMG Electrodes
Materials
Basic Protocol 2: Recording EEG/EMG During Experiment
Materials
Basic Protocol 3: Data Acquisition
Materials
Basic Protocol 4: Determining Behavioral State Based on the EEG and EMG Signals (i.e., “Scoring”)
Materials
Basic Protocol 5: Spectral Analysis
Materials
|
Figures
-
Figure 1. Mouse placed in the stereotaxic frame for EEG and EMG implantation. In this picture, the head is kept in place by earbars and a nose clamp. Note that the earbars are not inserted into the ear canal but put backwards just to restrain head movements in the horizontal plane. The nose clamp is sufficient to keep the head fixed in the vertical plan. The eyes are protected with eye protective gel (encircled). The nose is fixed by placing the teeth of the mouse into the tooth holder part of the custom‐made nose clamp (arrow). View Image -
Figure 2. Schematic view of the mouse skull, indicating the position of the two recording electrodes and the four anchor screws over the cerebral hemispheres. In this configuration, the EEG signal is acquired as a bipolar derivation. View Image -
Figure 3. EEG electrodes are screwed into the skull, EMG electrodes are placed into the neck muscles and the entire assembly is fixed to the screws and skull with dental cement. All electrode leads are oriented in such a fashion that they can be easily soldered to the connector. Note that screws are not yet completely covered with cement. Also note tongue sticking out (arrow). View Image -
Figure 4. Schematic description of the experimental recording setup. The mouse has been implanted with EEG/EMG electrodes and connected to a head‐mounted connector (1). The connector is attached to a recording cable (2) that is linked to a commutator (3) which transfers the signal to the acquisition unit (4). The processed signal is then transferred to a computer installed with a specific EEG/EMG acquisition and analysis software (5). View Image -
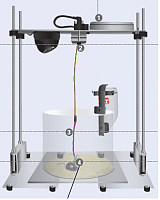
Figure 5. The mouse is placed into a cage, and connected via connector 1 to a recording cable that allows free movement of the animal within the cage but also allows the commutator to turn easily without first twisting the cable. The cable is linked to the connector 2 which joins the commutator. The latter brings up the signal to the hardware (see ). View Image -
Figure 6. Example of EEG/EMG signals for wakefulness, NREMS, and REMS. (A ) During wakefulness, the EEG trace is composed of mixed frequencies, and muscle tone is present on the EMG. (B ) NREMS is characterized by high amplitude and low frequency EEG oscillations, ranging from 1 to 4 Hz; muscle tone is low. (C ) During REMS, EEG shows regular theta waves (6 to 9 Hz) and EMG is flat except for rhythmic heart‐rate artifact. View Image -
Figure 7. EEG delta power during NREMS (upper panel) and distribution of NREMS during 48‐hr baseline, 6‐hr sleep deprivation (SD), and 18‐hr recovery (lower panel). Delta power increases during the dark period (gray parts) and decreases during the light period (white parts). After 6 hr of SD, delta power reaches its highest values, and decreases rapidly during the rest period. Changes in delta power are said to be driven by the distribution of NREMS; during the light period, when NREMS is prevalent (∼40 min/hr), EEG delta power gradually decreases, while during the dark period, when less time is spent in NREMS especially immediately following dark onset, delta power is increased in subsequent NREMS. After a 6‐hr SD, NREMS distribution is changed compared to the baseline periods. View Image -
Figure 8. Average EEG power spectrum density for wakefulness (green line), NREMS (blue line), and REMS (red line) calculated over a 24‐hr baseline recording period ( n = 7 C57Bl/6J mice). The upper graph represents the power density of the signal (in µV2 /0.25 Hz) for each frequency band. To illustrate EEG activity at higher frequencies in the lower graphs, the same spectra are plotted on a log10 scale. The interruption of the power density signal at around 50 Hz is due to the notch filter that has been used to remove line artifacts. Wakefulness is characterized by a low power in the low frequencies, whereas the EEG during REMS shows a prominent peak of power density at around 7 Hz, i.e., in the theta frequency range, and NREMS has high power in the delta band (1 to 4 Hz), consistent with the presence of slow waves in the EEG. Please note that wakefulness is not further differentiated into specific behaviors, each with a specific spectral profile; the spectral profile during, e.g., exploratory behavior will resemble that of REMS with its prominent theta peak. View Image -
Figure 9. Plot of EEG spectral composition changes at the transitions from NREMS (−3 to 0 min) to REMS (0 to +2 min). Power density within 0.25 Hz bins is expressed as a percentage of the mean power density for that bin over 4‐sec windows scored as NREMS in the first 2 min (i.e., −3 to −1 min) of the transitions to visualize relative spectral changes. Contour lines connect levels of similar relative power density in 8 color–coded 20% increments. Significant EEG changes start during the first minute prior to REMS onset and entail a marked increase in EEG activity in the spindle frequency range (10 to 15 Hz), shortly followed by an increase in theta activity (5 to 10 Hz). Maximum spindle activity is reached around −25 sec, while maximum theta activity is reached at the transition. After the transition, spectral values reach their typical REMS levels with, below 35 Hz, no other activity than theta, and above 35 Hz, high EEG activity including gamma (35 to 60 Hz). View Image -
Figure 10. The piezoelectric system is a noninvasive alternative to EEG/EMG recordings. The mice are placed in separate housing cages containing litter and food and water ad libitum (A ). In this setup, four mice can be recorded at the same time (B ). The piezoelectric film (C ) is placed on the bottom of each animal cage and used as an ultra‐sensitive motion detector to identify NREMS based on rhythmic activity related to the chest‐wall movements related to regular breathing patterns during this state. View Image
Videos
Literature Cited
| Literature Cited | |
| Adamis, D., Sahu, S., and Treloar, A. 2005. The utility of EEG in dementia: A clinical perspective. Int. J. Geriatr. Psychiatry 20:1038‐1045. | |
| Campbell, I.G. 2009. EEG recording and analysis for sleep research. Curr. Protoc. Neurosci. 49:10.2.1‐10.2.19. | |
| Chemelli, R.M., Willie, J.T., Sinton, C.M., Elmquist, J.K., Scammell, T., Lee, C., Richardson, J.A., Williams, S.C., Xiong, Y., Kisanuki, Y., Fitch, T.E., Nakazato, M., Hammer, R.E., Saper, C.B., and Yanagisawa, M. 1999. Narcolepsy in orexin knockout mice: Molecular genetics of sleep regulation. Cell 98:437‐451. | |
| Donohue, K.D., Medonza, D.C., Crane, E.R., and O'Hara, B.F. 2008. Assessment of a non‐invasive high‐throughput classifier for behaviours associated with sleep and wake in mice. Biomed. Eng. Online 7:14. | |
| Flores, A.E., Flores, J.E., Deshpande, H., Picazo, J.A., Xie, X.S., Franken, P., Heller, H.C., Grahn, D.A., and O'Hara, B.F. 2007. Pattern recognition of sleep in rodents using piezoelectric signals generated by gross body movements. IEEE Trans. Biomed. Eng. 54:225‐233. | |
| Franken, P., Malafosse, A., and Tafti, M. 1998. Genetic variation in EEG activity during sleep in inbred mice. Am. J. Physiol. 275:R1127‐R1137. | |
| Franken, P., Malafosse, A., and Tafti, M. 1999. Genetic determinants of sleep regulation in inbred mice. Sleep 22:155‐169. | |
| Franken, P., Chollet, D., and Tafti, M. 2001. The homeostatic regulation of sleep need is under genetic control. J. Neurosci. 21:2610‐2621. | |
| Franken, P., Dudley, C.A., Estill, S.J., Barakat, M., Thomason, R., O'Hara, B.F., and McKnight, S.L. 2006. NPAS2 as a transcriptional regulator of non‐rapid eye movement sleep: Genotype and sex interactions. Proc. Natl. Acad. Sci. U.S.A. 103:7118‐7123. | |
| Hasan, S., Dauvilliers, Y., Mongrain, V., Franken, P., and Tafti, M. 2010. Age‐related changes in sleep in inbred mice are genotype dependent. Neurobiol. Aging 33:195.e13‐26. | |
| Leeb, R., Sagha, H., Chavarriaga, R., and Millán, J. del R. 2011. A hybrid brain‐computer interface based on the fusion of electroencephalographic and electromyographic activities. J. Neural Eng. 8:025011. | |
| Leproult, R. and Van Cauter, E. 2010. Role of sleep and sleep loss in hormonal release and metabolism. Endocr. Dev. 17:11‐21. | |
| Martín del Campo, C., Velazquez, J.L., and Freire, M.A. 2009. EEG recording in rodents, with a focus on epilepsy. Curr. Protoc. Neurosci. 49:6.24.1‐6.24.24. | |
| Osselton, J.W. 1965. Acquisition of EEG data by bipolar, unipolar and average reference methods: A theoretical comparison. Electroencephalogr. Clin. Neurophysiol. 19:527‐528. | |
| Pack, A.I., Galante, R.J., Maislin, G., Cater, J., Metaxas, D., Lu, S., Zhang, L., Von Smith, R., Kay, T., Lian, J., Svenson, K., and Peters, L.L. 2007. Novel method for high‐throughput phenotyping of sleep in mice. Physiol. Genomics 28:232‐238. | |
| Tang, X. and Sanford, L.D. 2002. Telemetric recording of sleep and home cage activity in mice. Sleep 25:691‐699. | |
| Semmlow, J.L. 2004. Biosignal and biomedical image processing: MATLAB‐based applications. Marcel Dekker, Inc., New York. | |
| Tsiptsios, D.I., Howard, R.S., and Koutroumanidis, M.A. 2010. Electroencephalographic assessment of patients with epileptic seizures. Expert Rev. Neurother. 10:1869‐1886. | |
| Weiergraber, M., Henry, M., Hescheler, J., Smyth, N., and Schneider, T. 2005. Electrocorticographic and deep intracerebral EEG recording in mice using a telemetry system. Brain Res. Brain Res. Protoc. 14:154‐164. | |
| Willie, J.T., Chemelli, R.M., Sinton, C.M., Tokita, S., Williams, S.C., Kisanuki, Y.Y., Marcus, J.N., Lee, C., Elmquist, J.K., Kohlmeier, K.A., Leonard, C.S., Richardson, J.A., Hammer, R.E., and Yanagisawa, M. 2003. Distinct narcolepsy syndromes in Orexin receptor‐2 and Orexin null mice: Molecular genetic dissection of Non‐REM and REM sleep regulatory processes. Neuron 38:715‐730. |